Do you like traffic jams? Do you enjoy queuing in long lines?
Chances are you’ll answer no. That’s normal. Nobody likes wasting time. Whether in the car, at the supermarket, or in front of a screen. It’s all about getting things done.
A slow site is like a summer traffic jam on the highway: it’s catastrophic. It makes you want to leave and never come back.

Fortunately, there are tools to check that a site loads quickly. For example, have you ever tested your WordPress pages on Google PageSpeed Insights?
If so, do you really know how to use and benefit from this tool? If not, you’re probably eager to learn how to use it.
By the end of this comprehensive guide, PageSpeed Insights will hold no secrets for you. You’ll be able to master it like a pro and give your pages a real boost.
Ready to delight your visitors? Let’s get started!
Overview
- What is PageSpeed Insights?
- How does Google PageSpeed Insights work?
- Why should you use PageSpeed Insights to evaluate the performance of your WordPress site?
- How do you measure the loading speed of a WordPress page with PageSpeed Insights?
- How do you analyze a PageSpeed Insights report?
- How can you improve your WordPress site’s PageSpeed Insights score?
- Is a 100/100 PageSpeed Insights score really necessary?
- What are the alternatives to PageSpeed Insights?
- Conclusion
What is PageSpeed Insights?
PageSpeed Insights (PSI) is a free tool offered by Google that analyzes the user experience of a web page (performance, accessibility, SEO etc.), on both mobile and desktop devices.
PSI also provides optimization opportunities and offers suggestions for improving the loading speed of the page tested.
To evaluate a page, Google PageSpeed Insights assigns a score from 0 to 100. The closer your score is to 100, the better your page’s user experience, and vice versa.

This score measures various factors (unused resources blocking rendering, image optimization, initial server response time, etc.), including Core Web Vitals.
Core Web Vitals are a set of metrics created by Google to evaluate the actual user experience (UX) of a web page. Check out our complete guide to Core Web Vitals on the blog.
Google PageSpeed Insights should not be confused with Google Test My Site. Less valuable today, this tool enabled you to carry out a mobile optimization test to measure the speed of your individual pages and your mobile site as a whole.
How does Google PageSpeed Insights work?
To calculate the PageSpeed Insights score of a page on your WordPress site, Google’s tool relies on Lighthouse.
Also offered by Google free of charge, “Lighthouse is an automated website auditing tool that helps developers diagnose issues and identify opportunities to improve the user experience of their sites,” says Google.“It measures several dimensions of user experience quality in a lab environment, including performance and accessibility.”
You may have gotten hung up on the term “lab environment”. The phrase is vague at first glance, but note that it has nothing to do with the pharmaceutical industry or medical research. ^^
However, it’s important to understand what this term does mean, because it has implications for the way PageSpeed Insights works.
PageSpeed Insights laboratory data
To calculate your overall score, PageSpeed Insights first uses data collected in a laboratory environment (lab data).
Google points out that lab data “is useful for debugging problems, as it is collected in a controlled environment.”
Basically, Lighthouse simulates the loading of a page based on a single device and a fixed set of network conditions (4G network, mid-range device, etc.).
Given these characteristics, these data do not present a faithful representation of your visitors’ user experience.
Field data
To best reflect reality, PageSpeed Insights also relies on field data.
According to Google, this data collected over the past 28 days “corresponds to anonymous performance data from real-world users on a variety of devices and network conditions.”
They are provided from the Chrome User Experience Report (CrUX) dataset.
The metrics involved are as follows:
- The 3 metrics taken into account in Core Web Vitals (I’ll come back to this in detail later): Largest Contentful Paint (LCP), First Input Delay (FID), and Cumulative Layout Shift (CLS)
- First Contentful Paint (FCP)
- Interaction to Next Paint (INP)
- Time to First Byte (TTFB), a metric still in the experimental phase at the time of writing
In short, it’s perfectly normal to obtain different laboratory and field data for the same page under test.
The reason is simple: with laboratory data, the test variables are much more limited than with field data.
A laboratory test uses a single device connected to a single network from a single geographical location.
In contrast, field data is based on different networks and devices from real user data.
Why should you use PageSpeed Insights to evaluate the performance of your WordPress site?
Having a high-performance site, with pages that load quickly is crucial to enhancing your visitors’ user experience:
- When a page goes from loading in one second to three seconds, its bounce rate is likely to increase by 32%.
- The conversion rate of a website decreases by 4.42% for each additional second of loading (for loading times between zero and five seconds).
- Almost 70 percent of consumers agree that page speed has an impact on their willingness to buy from an online retailer.
Undeniable advantages
That’s why it’s important to regularly test the performance of your pages to make sure they’re optimized. Google Insights is the tool of choice for several reasons:
- It’s free.
- It’s easy to understand and suitable for beginners: it’s color-coded, so you can quickly see what’s working well and what’s not.
- It provides results relating to Core Web Vitals, which are taken into account by Google’s algorithm to index a page. Even if Core Web Vitals are not the most important factor in Google’s eyes, the search engine can use them to distinguish between two pages offering content that is equally useful to the surfer. The page best optimized for Core Web Vitals can then be better positioned than its competitor.
So, without further ado, it’s time to get to work. In the next section, find out how to analyze the performance of a page on your WordPress site with PageSpeed Insights.
How do you measure the loading speed of a WordPress page with PageSpeed Insights?
Which pages you should analyze with PSI
Before you dive headlong into analyzing a page, it’s a good idea to ask yourself one question: which page should you test?
Logically, the first thing you’re likely to think of is your home page. Sure, why not, but is it really the most strategic choice for your WordPress site?
To do things properly, I recommend that you start by focusing on the pages that generate traffic — or even sales — on your site.
If there are issues on these pages, you stand a good chance of improving your conversion rate by fixing them.
To find out which pages are most strategic for your business, use your favorite statistical analysis tool (Google Analytics, Matomo, Plausible, etc.).
To find out which pages your users visit first, use the Reports > Lifecycle > Engagement > Pages and Screens menu in Google Analytics 4:

That’s a good place to start. Of course, there’s nothing to stop you testing your home page as well. 😉 PageSpeed Insights doesn’t impose any limitations, so you’re free to indulge yourself.
However, if you have a site with hundreds of pages, you’re likely to find it takes a long time. That’s why you should concentrate on the pages that are worth your time.
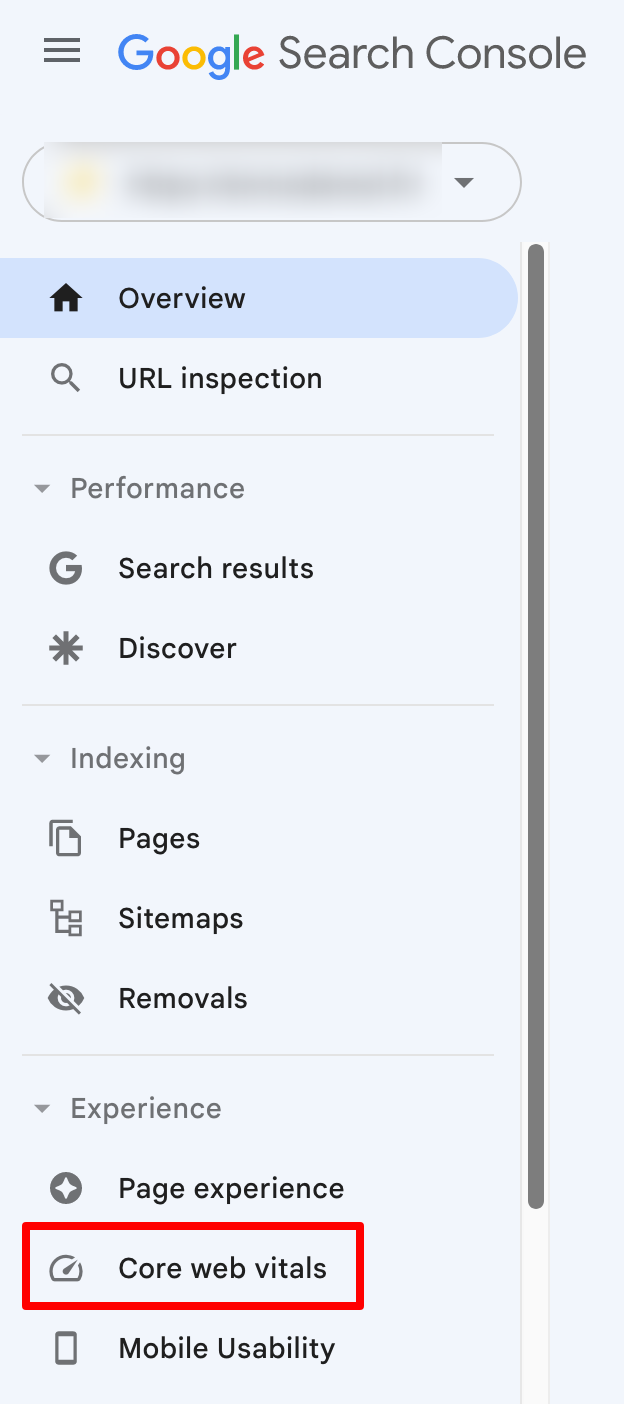
You can also make use of another free tool offered by Google: Search Console.
This tool has a menu called “Core Web Vitals”. This menu will show you which URLs are slow and which you need to improve in order to optimize your Core Web Vitals:
To take advantage of Google Search Console, you need to have a Google account and link it to your WordPress site.
To make your work easier, you can compile the URLs to be analyzed in a spreadsheet with Google Sheets, or a word-processing tool like Google Docs.
Page testing process
Once you’ve identified a problematic page, the next step is very simple. Go to the official PageSpeed Insights website.
Enter the URL of your choice in the field provided. Then click on the blue “Analyze” button:
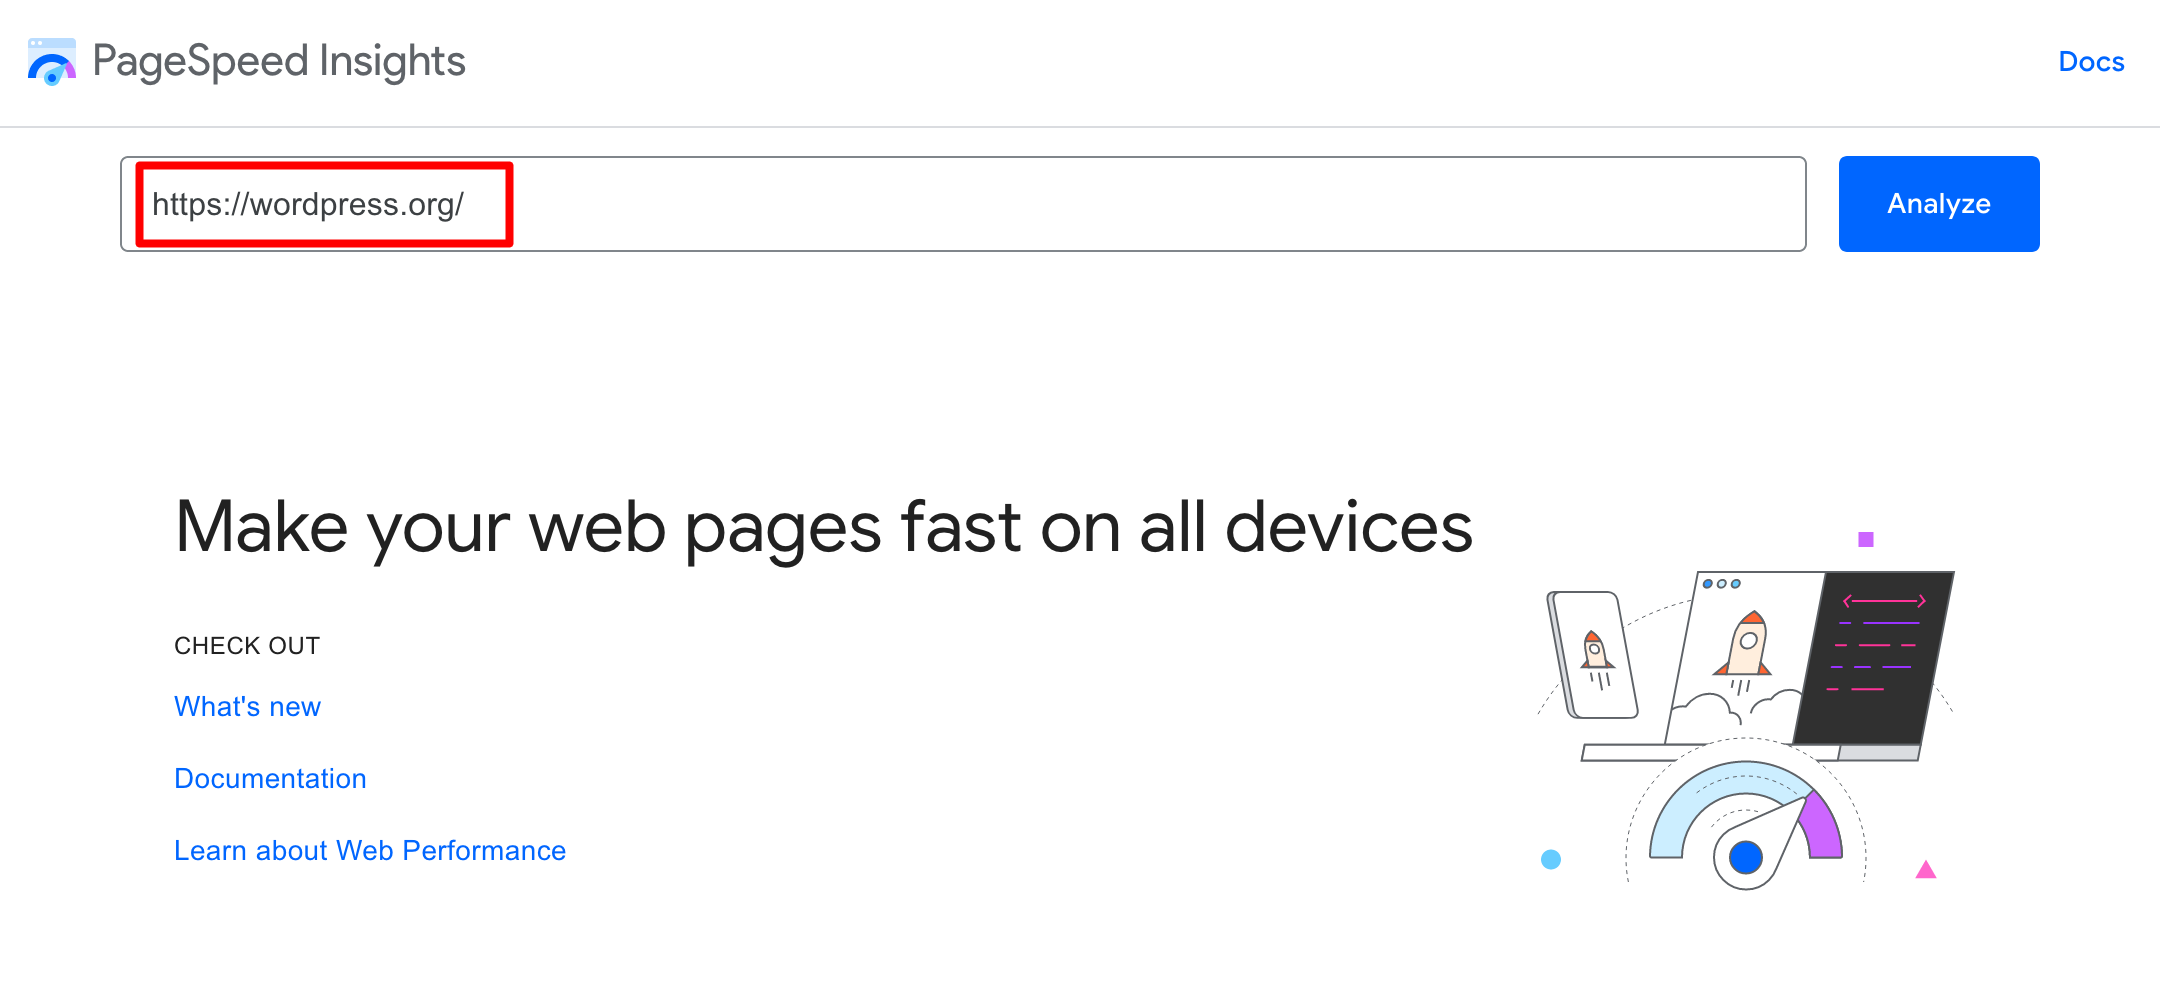
After a few seconds, PSI will offer you an analysis report, which I’ll explain in the next section.
How do you analyze a PageSpeed Insights report?
Evaluation of Core Web Vitals
Main metrics taken into account by PageSpeed Insights
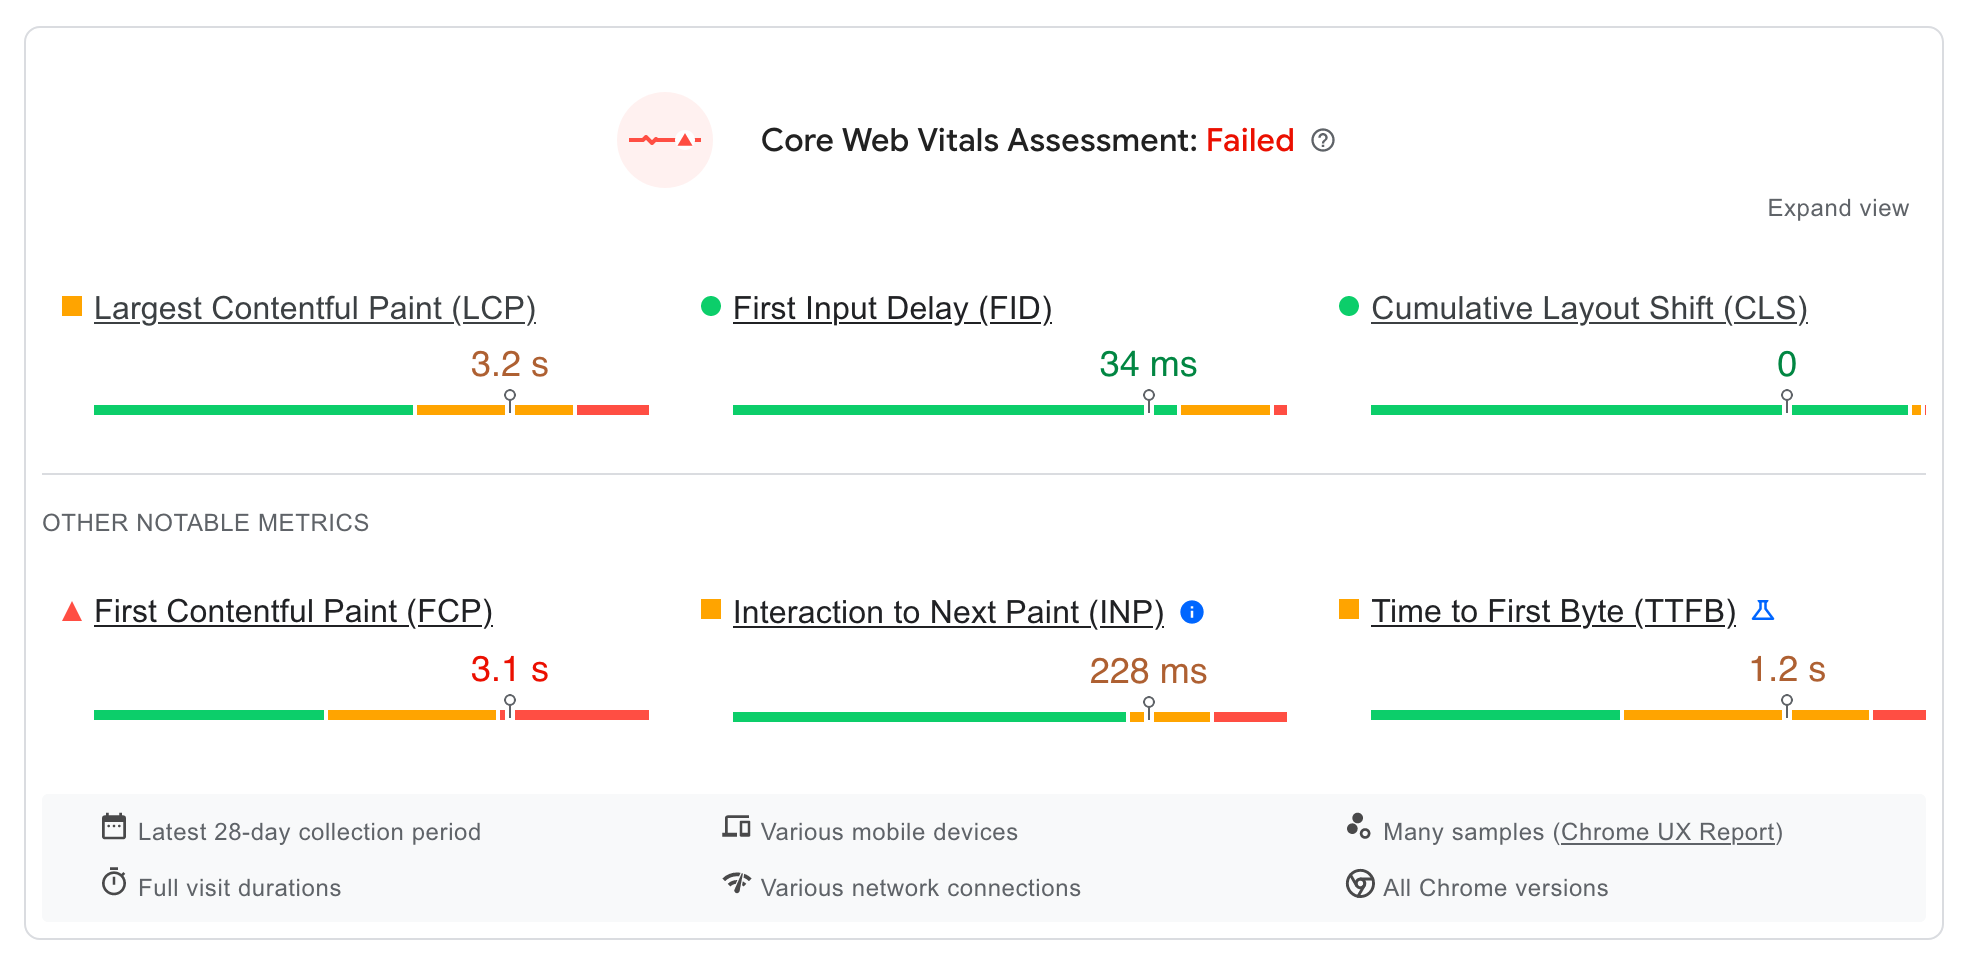
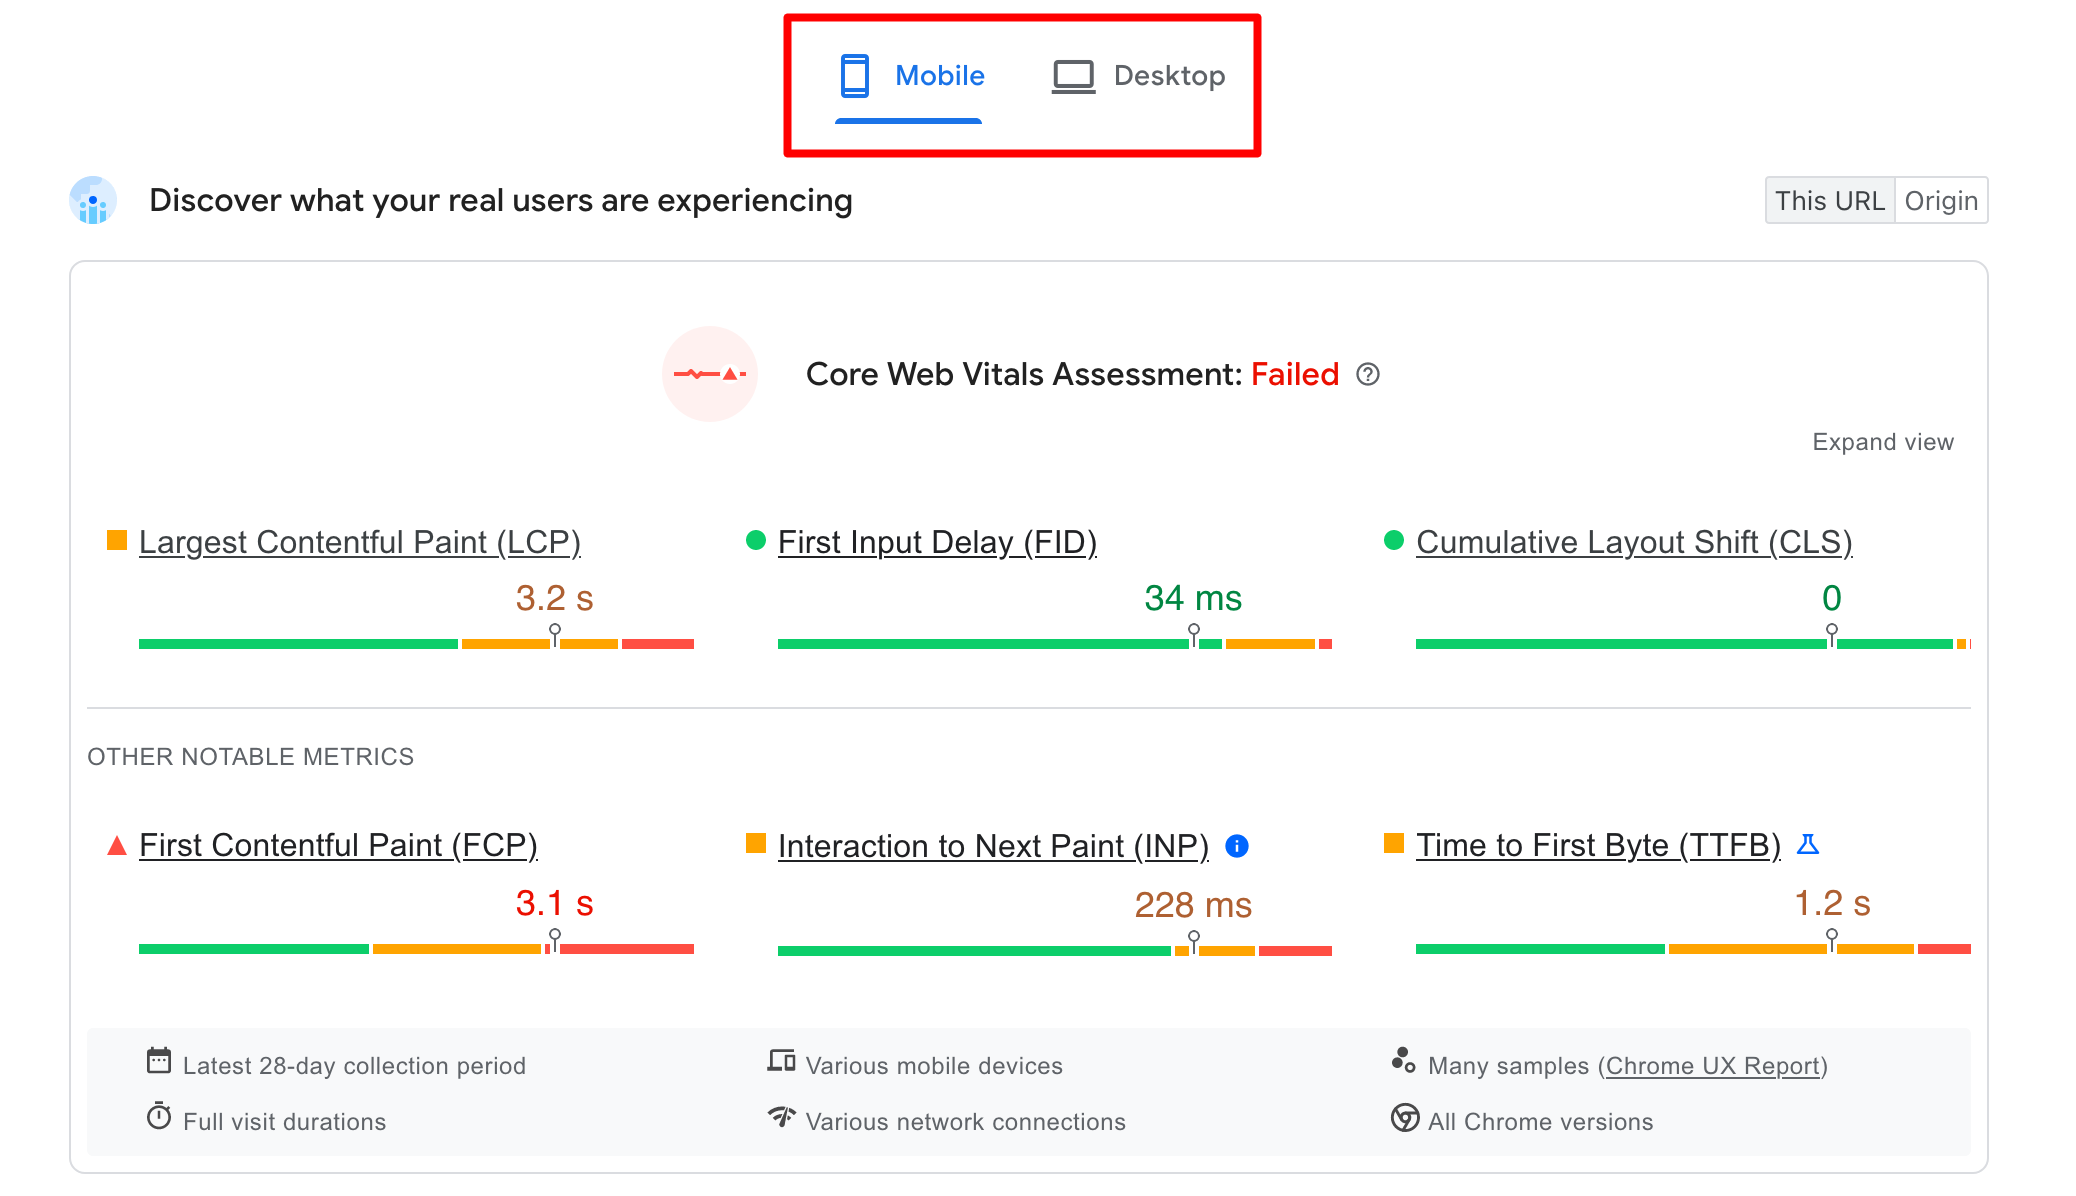
First, Google PageSpeed Insights evaluates your Core Web Vitals by presenting you with the so-called field data, labeled pass (green) or fail (red).
In this first section, you’ll find the results of the following core metrics:
- Largest Contentful Paint (LCP), which evaluates the display time of the largest visible element of your page in your browser window, from the moment the page begins to load.
- First Input Delay (FID), which measures the delay between the moment when an Internet user first interacts with your page (clicking on a link, pressing a button, etc.) and the moment when the browser responds to this interaction.
- Cumulative Layout Shift (CLS), which measures visual stability by evaluating each unexpected shift in your layout, for example when a visible element suddenly changes position during page loading.
Other notable metrics
Just below, the report presents “other notable metrics” (not taken into account when evaluating Core Web Vitals):
- First Contentful Paint (FCP), which measures the time elapsed between the start of page loading and the moment when part of the page content is displayed on the screen.
- Interaction to Next Paint (INP), which evaluates a page’s overall responsiveness to user interaction by observing the latency of all click, tap, and keyboard interactions that occur during the lifetime of a user’s visit to a page. Note that INP will replace FID from March 2024.
- Time to First Byte (TTFB) measures the time elapsed between the request by a web browser and the moment when the first byte of a response by the server begins to arrive.

Color code analysis
For each metric, the result is usually expressed in seconds (s) or milliseconds (ms).
The only exception is the CLS metric, which displays a score between zero and a positive number. The higher the number, the more offset the layout.
PSI uses color categories in the form of bars to present its results:
- Green means the optimization is good.
- Orange indicates “needs improvement.”
- Red corresponds to a poor score.
If you click on “Expand view,” you’ll find a percentage indicator for each category (“Good,” “Needs Improvement,” or “Poor”).
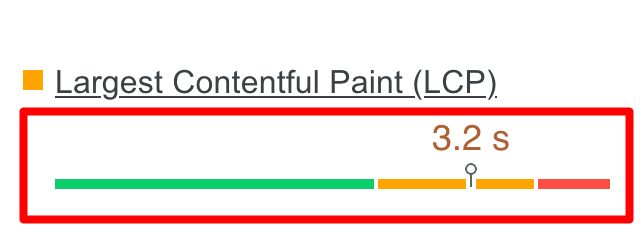
For example, in the screenshot below, the 58% indicator in the green bar indicates that 58% of all LCP values observed by PSI are below (or equal to) 2.5 seconds.
To provide these rankings, Google PageSpeed Insights uses the 75th percentile value.
This means that if at least 75% of a site’s page views meet the “good” threshold, the site is classified as performing “well” on this metric.
If you’d like to have something to benchmark yourself against, PSI defines the following thresholds for classifying the quality of user experience:

To conclude, you can also switch from the mobile report to the desktop report with one click (with a score that will be different between the two devices).
So it’s possible that you’ve passed the Core Web Vitals test for the mobile version of your page, while failing it for the desktop version of the same page:
Analyzing performance problems
If you scroll down the page a little, you’ll come across the performance issues analysis.
This is what corresponds to the lab data we talked about earlier. Here, PageSpeed Insights first presents you with scores for 4 categories:
- Performance
- Accessibility
- Best practices
- SEO
These scores are interpreted as follows:
- If you score 90 or more, the score is considered satisfactory (green circle).
- If you score between 50 and 89, the score requires improvement (orange square).
- If you score less than 50, the score is considered poor (red triangle).

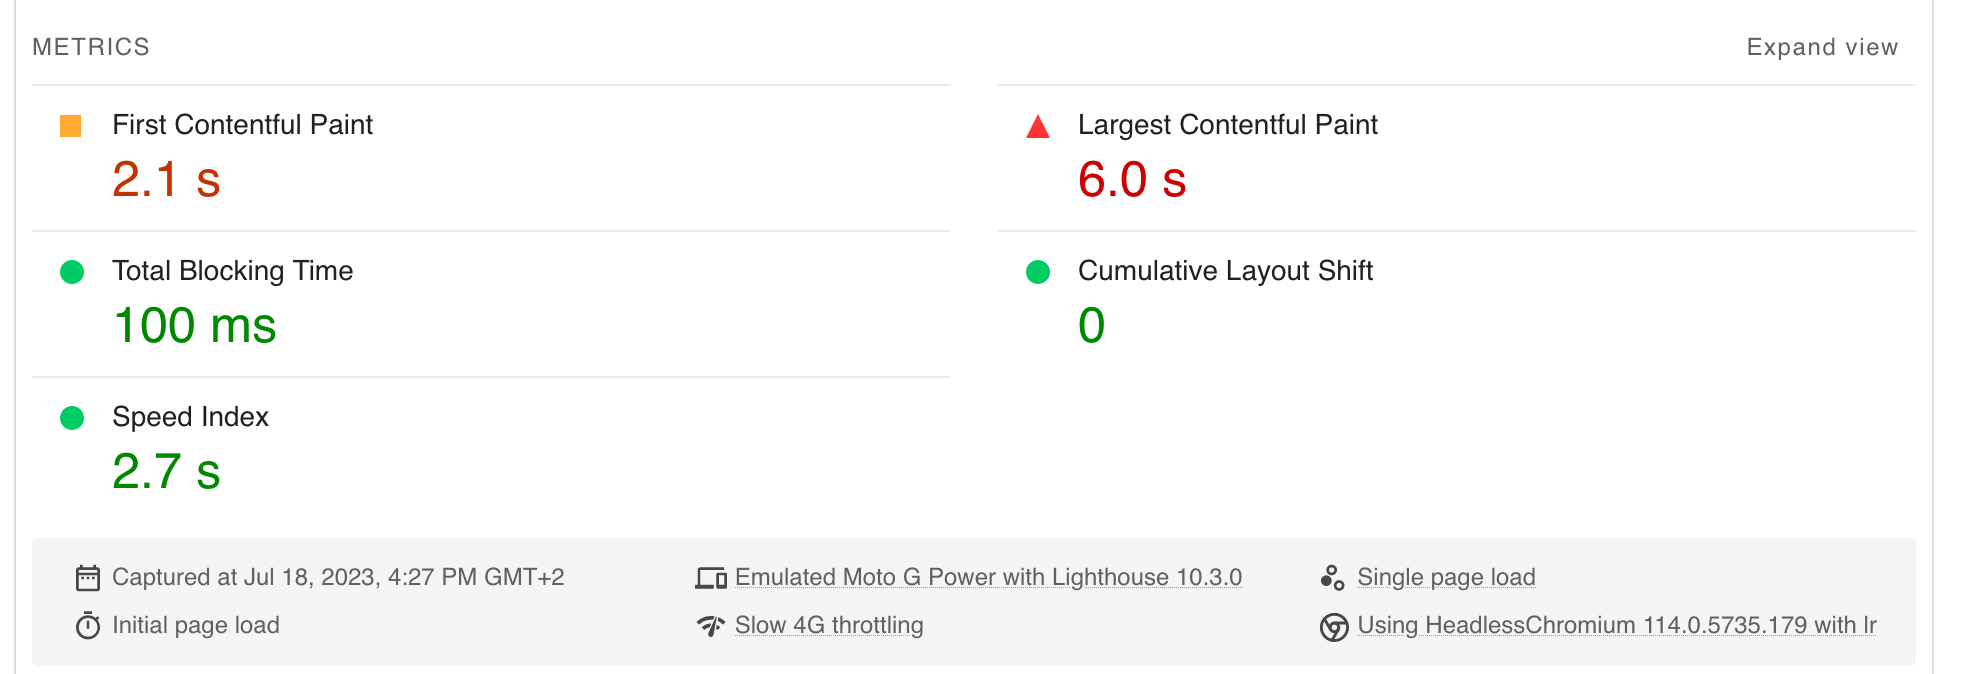
Just below, you’ll find five statistics. These include two of the three Core Web Vitals (Largest Contentful Paint and Cumulative Layout Shift), but also:
- First Contentful Paint
- Total Blocking Time, which measures the time elapsed between the FCP and the delay before interactivity, when the task duration has exceeded 50 ms
- Speed Index, which measures the speed with which content is visually displayed when a page is loaded

Opportunities and Diagnosis
The third section of the analysis report concerns Opportunities and Diagnosis. This is where you’ll find recommendations for improving your site’s loading speed and user experience.
In concrete terms, PageSpeed Insights suggests actions you can take to help optimize your site.

For example, in the screenshot above, you can see that the tool suggests:
- Properly size images
- Reduce unused JavaScript resources
- Reduce unused CSS resources
- Eliminate resources that block rendering
- Defer loading offscreen images
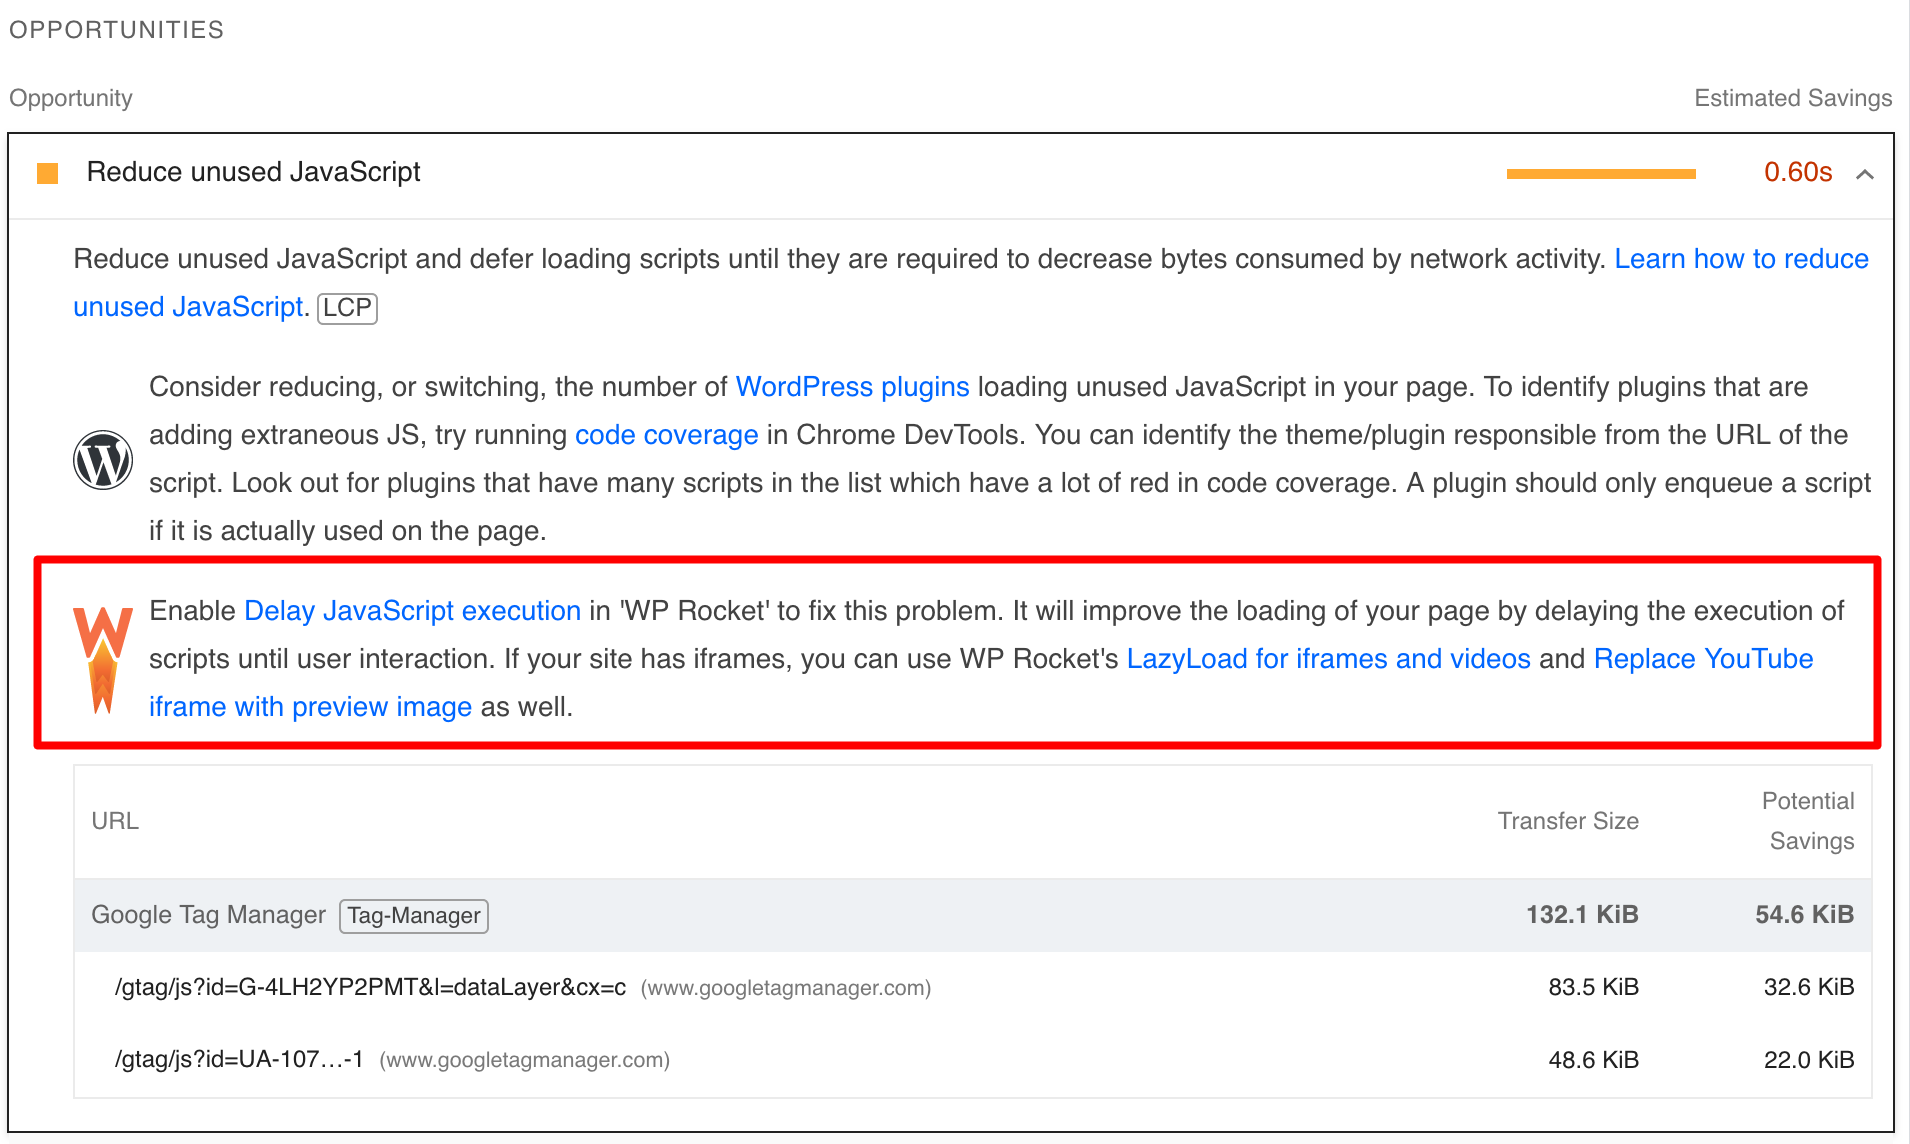
For each recommendation, an estimate of the savings (in terms of loading time) is provided. For example, by reducing unused JavaScript resources, I would improve my LCP score by 0.90s.
What makes this tool so useful is that it doesn’t just tell you what to do, it also tells you how to do it.
For example, it can detect the WordPress CMS and make plugin recommendations to resolve a sticking point.
If you click on the little downward arrow, you can see that I’m specifically asked to activate a feature in the WP Rocket plugin to reduce unused JavaScript resources:

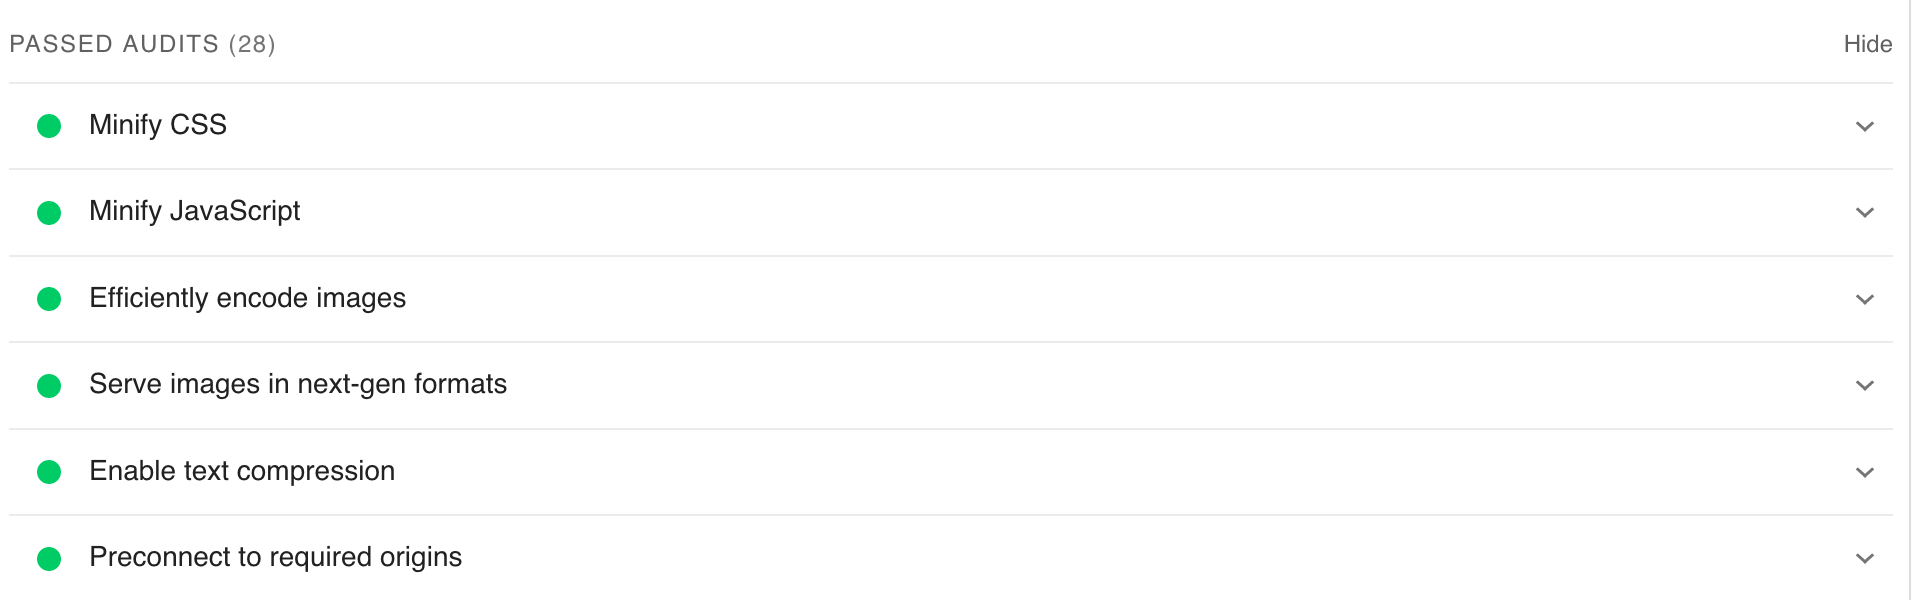
Successful audits
Finally, the PageSpeed Insights analysis report includes a section titled “Passed Audits.”
The tool verifies that your page follows basic advice in three areas:
- Accessibility
- Best practices
- SEO
The closer your score is to 100, the less guidance you’ll receive to improve your page (which is a good sign).
Successful audits are indicated by green circles:
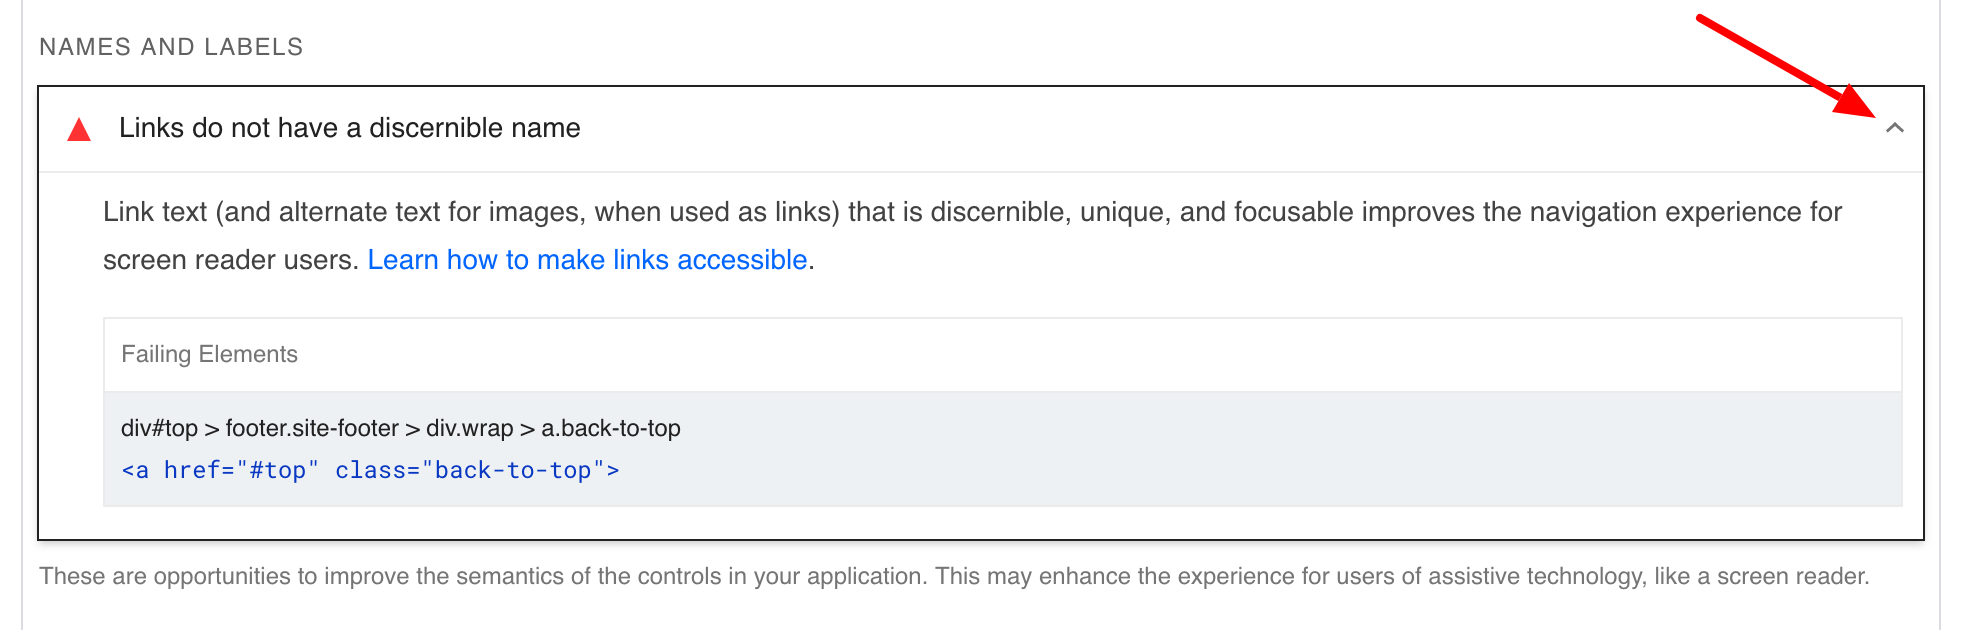
As soon as a problem is detected, PSI alerts you and explains why that particular point may be problematic, with a proposal to help you resolve it.
To find out more, click once again on the little down arrow associated with a problem:
That’s all for now. You now know how PageSpeed Insights works, and how to use it to analyze your WordPress pages.
In the next section, I’ll focus on a few points that will help you improve your WordPress site’s PageSpeed Insights score.
The official WordPress plugin directory offers a plugin, Insights from Google PageSpeed, to conduct your PSI tests from your dashboard. You’re free to use it or not. Personally, I prefer to use the online tool, so as not to overload my site with an additional plugin.
How can you improve your WordPress site’s PageSpeed Insights score?
To achieve the best possible score, you need to focus on opportunities that can help you reduce page load times.
When I ran tests on several pages from completely different sites (showcase, WooCommerce, etc.), I realized that PSI very often highlighted the same opportunities for improvement.
Let’s take a closer look.
Reduce unused CSS and JavaScript resources
It’s not uncommon for CSS and JavaScript resources to be loaded onto a page when they’re not actually being used.
It’s important to reduce them to improve page loading by deferring script execution until user intervention.
Incidentally, as PSI explains, this will “reduce the amount of bytes consumed by network activity.”
To solve this problem, activate the “Delay JavaScript execution” option in the “File Optimization” tab of the WP Rocket premium plugin (affiliate link).
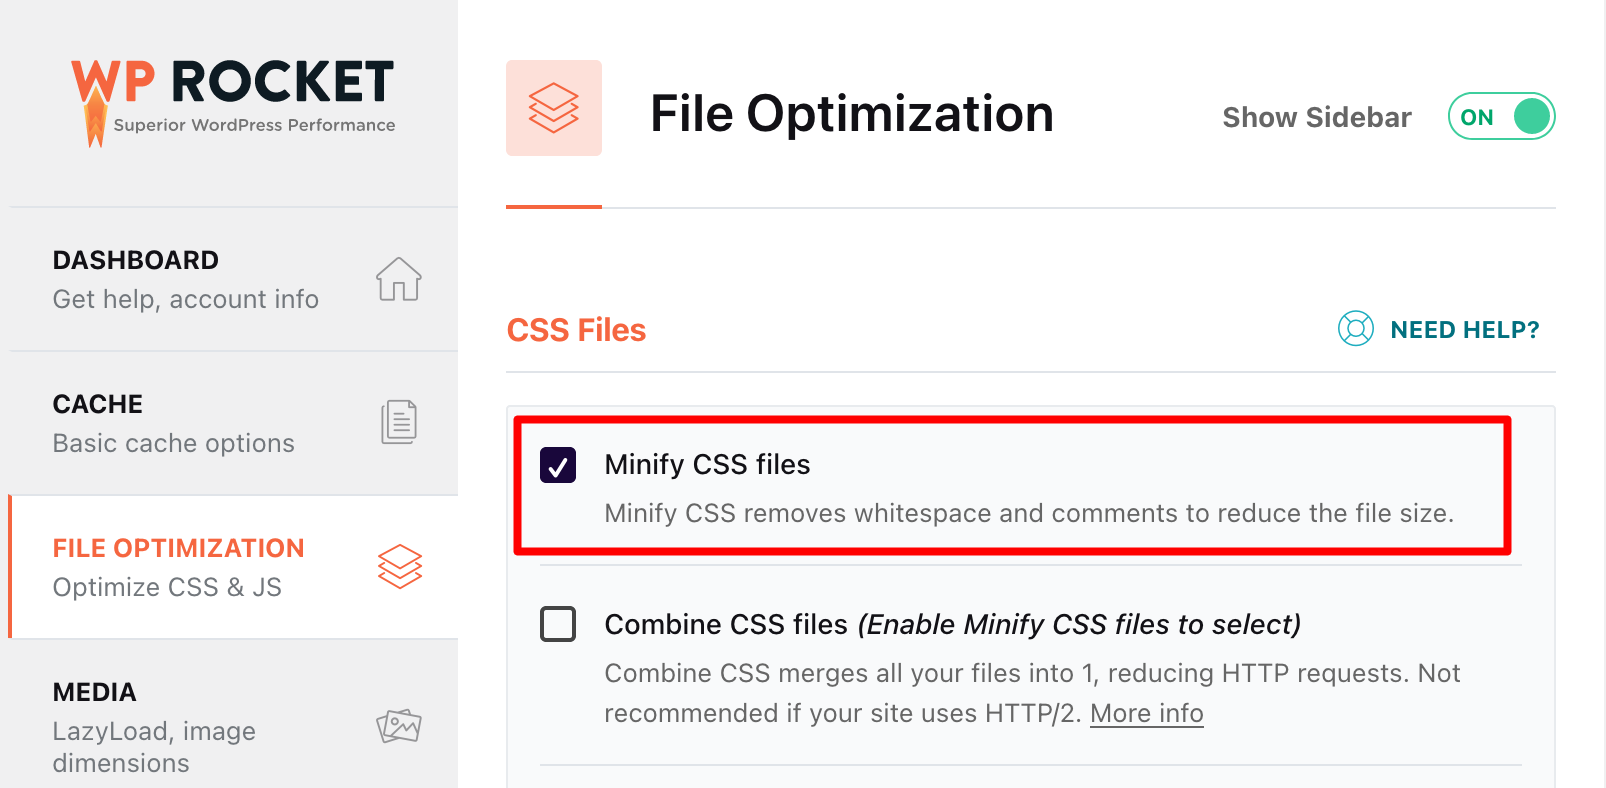
At the same time, take the opportunity to minimize your CSS and JavaScript code (i.e. reduce its size while preserving all its information).
You can do this by deleting spaces and comments, or by shortening the names of certain JavaScript functions and variables.
Here again, take advantage of WP Rocket by activating the “Minify CSS files” and “Minify JS files” options, again in the “File optimization” tab:
If you prefer to use a free plugin to optimize your CSS and JavaScript code, consider Autoptimize or Asset CleanUp. However, these will be more complex to manage than WP Rocket.
Eliminate resources that block rendering
Resources that block rendering — CSS and JavaScript scripts — are those that prevent a page from being viewed (first painted). As a result, loading times are negatively impacted.
To solve this problem, you can, for example, load JavaScript at a later time. If you’re using WP Rocket, check the box below in the “File optimization” tab:

Reduce initial server response time
The longer it takes for your server to respond to a browser request — the so-called TTFB — the slower your page will load.
Here are several recommendations for reducing the initial server response time:
- Opt for a high-performance web host like bluehost (affiliate link)
- Choose a light, well-coded theme such as Astra, Kadence, or Blocksy
- Remove unused plugins from your WordPress site
- Activate a recent version of PHP on your site (at least PHP 8.1 if you’re using the latest major version of WordPress at the time of writing)
- Optimize your database (WP Rocket allows you to schedule its automatic cleaning, for example)
- Activate gzip compression (or Brotli compression). Your hosting provider may already have activated it for you. Contact them to find out more. If not, WP Rocket will take care of it automatically.
Cache your pages
Next, make sure you use a caching system for your pages. Caching is a technique that involves storing a copy of a given resource (web page, image, etc.) so that it can then be communicated to the web visitor more quickly.
Once again, WP Rocket is the ideal tool for this. The plugin will cache your pages automatically (while optimizing your browser’s cache).
With WP Rocket, you don’t have to do a thing. As a free alternative, I recommend WP Fastest Cache.
Optimize and size your images
When it comes to optimizing the user experience, don’t leave your images out of the equation!
They’re often the first culprits behind a page’s high weight, so it’s a good idea to tackle this problem head-on.
Start by reducing their weight and resizing them (width and height). To do this, use the Imagify plugin, described in detail in this article.
Secondly, take the opportunity to distribute your images in new-generation formats. This is an opportunity often detected by PageSpeed Insights on WordPress.
As PSI points out: “Image formats such as WebP and AVIF often offer better compression than PNG and JPEG. As a result, downloads are faster and data consumption is reduced.”
Here again, a plugin like Imagify (affiliate link) will be your ally. It allows you to convert images in your Media Library to WebP format. To do this, check the “Create WebP versions of images” box in the “Optimization” menu:

If you implement these basic optimizations, the PageSpeed Insights score of your WordPress pages should improve over time.
Speaking of which, is 100/100 really the Holy Grail? Answer in the next section.

Is a 100/100 PageSpeed Insights score really necessary?
So, you’re giving 100% to achieve 100/100? While this may satisfy your ego, such a score will be very difficult to achieve, especially on the mobile version of your WordPress site.
The most important thing is to obtain a “Good” score (in the green) AND to apply the recommendations proposed by PSI.
If you tick both boxes, you’re doing very well indeed. Rest assured, Google won’t penalize you if you don’t score 100/100.
What’s more, an average score won’t prevent a site from working properly!
To take things a step further, the author of this article explains, for example, that he has already seen “sites with average loading times of under 500 milliseconds (which is extremely fast!) that don’t have a 100/100 score on PageSpeed Insights”.
In fact, the point on which you need to focus remains your site’s perceived performance, as the article adds.
Basically, if your visitors have the impression that your site loads fast, you’ve got it right (and ultimately it doesn’t matter how bad your PSI score is).
This is essentially what the experts at WP Rocket also recommend, as they point out: while performance rating services are useful, you shouldn’t focus on them too much, but rather on “the actual loading time of your site” and “the impression of fluidity.”
Finally, although page load speed has been a ranking criterion for positioning a page on Google since 2018, its impact remains low.
Conclusion: test and optimize your site to try to make the user experience as pleasant as possible: that’s yes! Bending over backwards to do so: that’s a big no!
What are the alternatives to PageSpeed Insights?
Not convinced by PageSpeed Insights? Here are some free or freemium alternatives for testing your page load speed:
For concrete instructions on how to use a performance measurement service, I recommend this tutorial on the WP Rocket blog.
Conclusion
By using Google PageSpeed Insights on your WordPress site, you can evaluate the user experience of your visitors.
With Google’s free tool, you have opportunities to improve your site’s loading speed and accessibility, while taking care of your Core Web Vitals.
Throughout these lines, you’ve learned about the following points in particular:
- How PageSpeed Insights works
- How to measure page load speed with PSI
- How to improve the Google PageSpeed Insights score of your WordPress site
Don’t hesitate to check in regularly and test your site’s speed whenever a major change occurs (e.g. the addition of a plugin, a theme, or any other feature).
You’ll then be in a position to rectify the situation if a slowdown is detected. At the same time, optimize your site’s overall performance. To do this, take a look at our guide: How to optimize a WordPress site without breaking the bank.
Do you use PageSpeed Insights? If so, let us know by writing a comment.

Receive the next posts for free and access exclusive resources. More than 20,000 people have done it, why not you?
Continue reading
Articles posted in WordPress TutorialsHow to update the PHP version of your WordPress site
What comes to mind when you think of WordPress speed and security? Your favorite plugins, perhaps? You should also think about… PHP! If you’re looking for a site that loads fast, while offering a solid shield against hacker attacks, there’s a…
How to create an effective HubSpot conversion funnel on WordPress (complete guide)
In the drawers of a kitchen, there are often two very useful utensils lying around. The first is the colander. And to illustrate, some WordPress sites unfortunately resemble it. Why? Well, because visitors arrive on the site in question… then…
How to fix the ERR_CONNECTION_REFUSED error: A complete guide
Does your browser display the ERR_CONNECTION_REFUSED message when you try to access a website? This error means that the target server – or your own configuration – is actively rejecting the connection request, leaving you at a dead end. But…